
Add your own performance counters to Application Insights

I have been trying Application Insights for awhile now and while it is a fantastic tool I do feel it is missing several important performance counters out-of-the-box for .NET applications. Among them are several counters from the .NET CLR Memory category which I'm going to use as an example for this blog post.
Application Insights allows you to easily add performance counters to the list of counters it already measures, and that is done by some simple little changes to the ApplicationInsights.config file (for regular ASP.NET web sites).
If you take a look at the ApplicationInsights.config file you'll find the TelemetryModules section near the top and under it is a PerformanceCollectorModule where you can add your own performance counters.
Here is an example of the .NET CLR Memory counters I added (mostly relating to the .NET Garbage Collector):
<Counters>
  <Add PerformanceCounter="\.NET CLR Memory(??APP_CLR_PROC??)\# Bytes in all Heaps" ReportAs="Bytes in all Heaps" />
  <Add PerformanceCounter="\.NET CLR Memory(??APP_CLR_PROC??)\% Time in GC" ReportAs="Percent of time spent in GC" />
  <Add PerformanceCounter="\.NET CLR Memory(??APP_CLR_PROC??)\# Gen 0 Collections" ReportAs="Gen Zero Collections" />
  <Add PerformanceCounter="\.NET CLR Memory(??APP_CLR_PROC??)\# Gen 1 Collections" ReportAs="Gen One Collections" />
  <Add PerformanceCounter="\.NET CLR Memory(??APP_CLR_PROC??)\# Gen 2 Collections" ReportAs="Gen Two Collections" />
  <Add PerformanceCounter="\.NET CLR Memory(??APP_CLR_PROC??)\Allocated Bytes/second" ReportAs="Allocated Bytes per Second" />
  <Add PerformanceCounter="\.NET CLR Memory(??APP_CLR_PROC??)\Gen 0 Promoted Bytes/Sec" ReportAs="Bytes Promoted from Gen Zero per Second" />
  <Add PerformanceCounter="\.NET CLR Memory(??APP_CLR_PROC??)\Gen 1 Promoted Bytes/Sec" ReportAs="Bytes Promoted from Gen One per Second" />
  <Add PerformanceCounter="\.NET CLR Memory(??APP_CLR_PROC??)\Gen 1 heap size" ReportAs="Gen One Heap Size" />
  <Add PerformanceCounter="\.NET CLR Memory(??APP_CLR_PROC??)\Gen 2 heap size" ReportAs="Gen Two Heap Size" />
  <Add PerformanceCounter="\.NET CLR Memory(??APP_CLR_PROC??)\Promoted Memory from Gen 0" ReportAs="Promoted Memory from Gen Zero" />
  <Add PerformanceCounter="\.NET CLR Memory(??APP_CLR_PROC??)\Promoted Memory from Gen 1" ReportAs="Promoted Memory from Gen One" />
</Counters>
The
??APP_CLR_PROC??string is a "magic variable" that the Application Insights runtime replaces with the identity of the CLR Process that runs the application to select the correct counters.
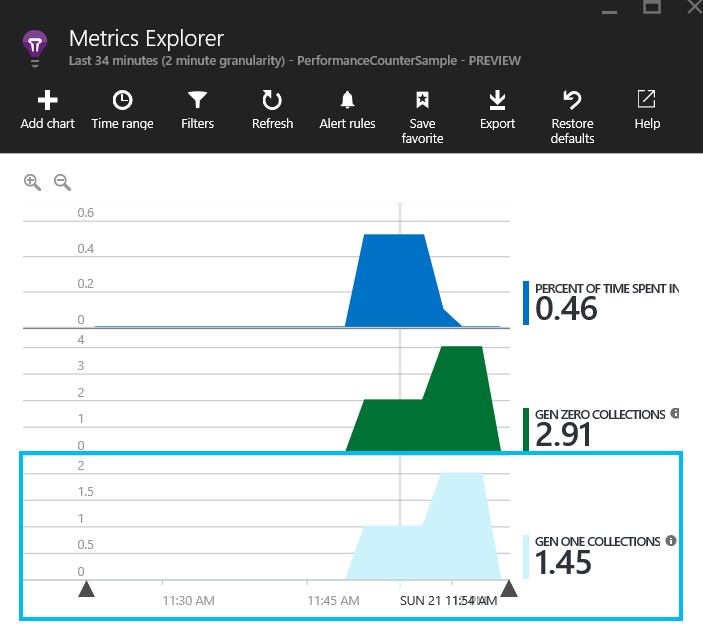
After adding these counters we can take a look at them using the Metrics Explorer in the Application Insights hub on the Azure Portal.
There is one caveat to remember as well. You need to make sure that the user running the website, for example the IIS Application Pool user, is a member of the local Performance Monitor Users group to be able to read performance counters from the system.
Adding an IIS application pool user to that group can be easily done with PowerShell like this (answer on Stack Overflow from Svein Fidjestøl):
$group = [ADSI]"WinNT://$Env:ComputerName/Performance Monitor Users,group"
$ntAccount = New-Object System.Security.Principal.NTAccount("IIS APPPOOL\ASP.NET v4.0")
$strSID = $ntAccount.Translate([System.Security.Principal.SecurityIdentifier])
$user = [ADSI]"WinNT://$strSID"
$group.Add($user.Path)
If you are running your website as a Windows Azure Web App, you don't need to worry about those permissions.
I hope this helps, and happy performance monitoring!