
Using HaveIBeenPwned, Application Insights and Grafana to detect credential stuffing attacks.
Today I want to share with you a method we use to detect and react to credential stuffing attacks in real-time using the PwnedPasswords API, Application Insights and Grafana.


Hi friends. Today I want to share with you a method we use to detect and react to credential stuffing attacks in real-time using the PwnedPasswords API, Application Insights and Grafana.
This all started a few days ago when I noticed, not for the first time, an unusual amount of failed login attempts as well as an unusual number of successful logins using pwned passwords. We monitor users logging in with pwned passwords so we can properly notify them to change to a more secure password, but we also monitor a few other metrics and we post all of them to Application Insights where we use the Grafana Azure Monitor data source to create dashboards out of these metrics so we can follow and see anomalies as they occur. Looking at our Grafana dashboards, the credential stuffing attack looked something like this:
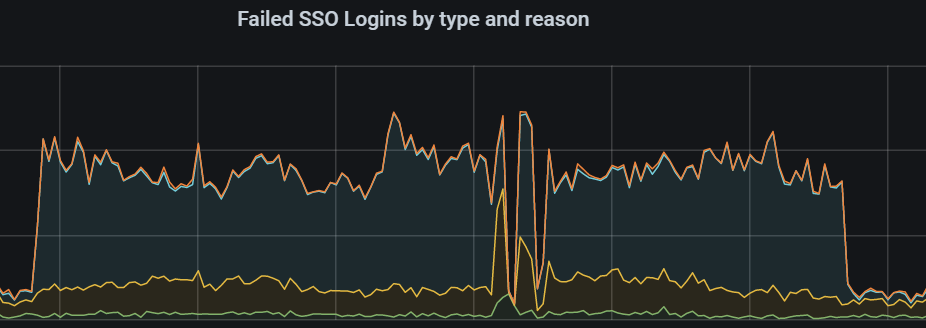
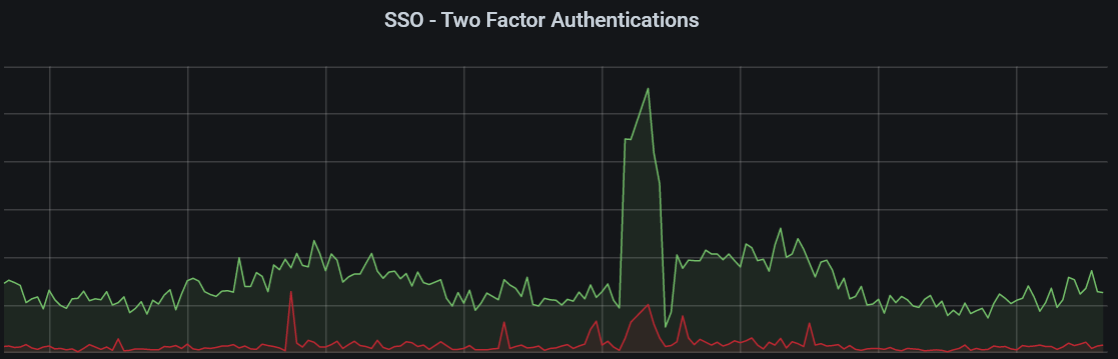
Obviously, something was off, if you look at the sides you can see our "normal" levels of failed login attempts and here we saw a huge spike over a period. We also saw an increase in issued 2FA challenges, which stems from an unusual amount of successful logins due to accounts using a pwned password, but us detecting an unknown machine, we issue a verification code challenge via. email, like Valve's Steam Guard.
I was looking at ways to detect this reliably without being affected by normal EVE server restarts or downtimes polluting the data too much. That where seasonality kicks in, since our downtimes are always at the same time, 11:00 UTC. After looking around a bit I found an awesome Kusto (the query language used for Application Insights) query called series_decompose_anomalies. You can read up on what it does by clicking the link, but basically it looks at historical data, maps out trends and forecasts and then scores the actual values against the forecast, giving you an indicator of when you might be looking at anomalous values.
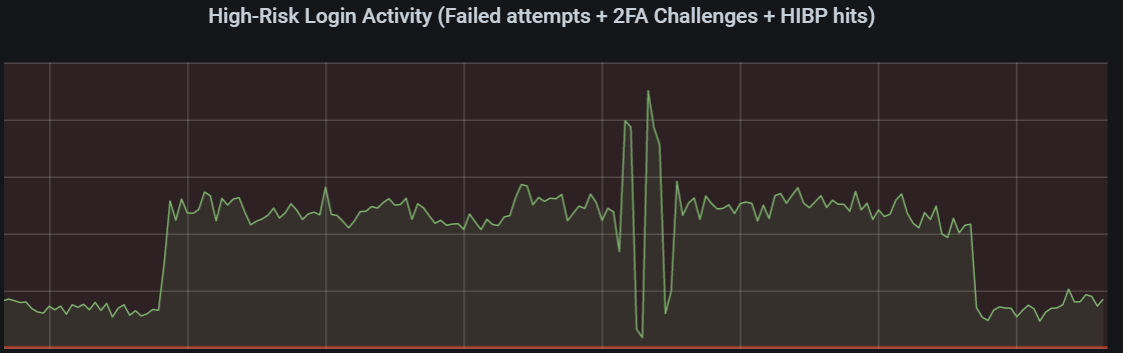
I needed to combine these metrics into one metric, which I called 'high-risk' activity. It consists of for example ratio of pwned passwords for successful logins, the number of of failed login attempts, 2FA challenges issued and more. Using the Application Insights anomaly detection query over this metric, and doing a little fine tuning gave me chart looking like this for the same period:
customMetrics
| where (name == "Password.Breached" or (name == "User.Login" and customDimensions["Result"] != "Success") or name == "User.2FAChallenge"
) and $__timeFilter()
| summarize ['Count'] = sum(valueCount) by bin(timestamp, $__interval)
| order by timestamp asc
Simplified version of the Application Insights query for our high-risk index.
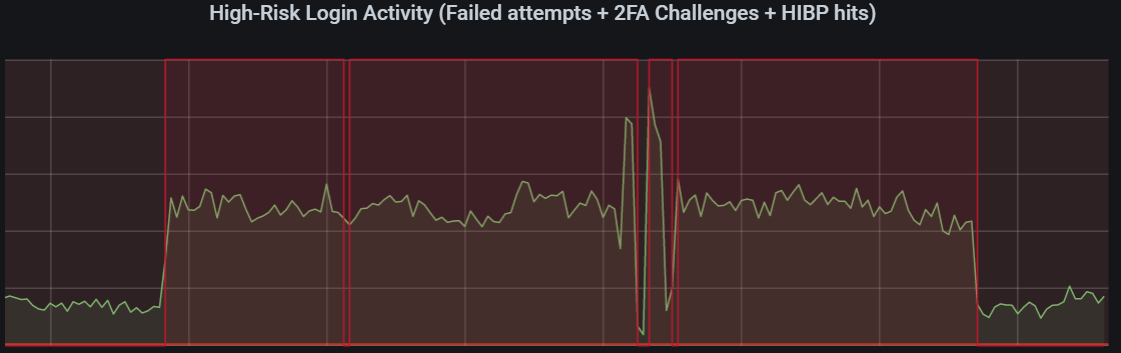
Then I added a second query to the Grafana chart, using the anomaly detection, which gives us a score of either 0 (everything is fine) and 1 (anomaly detected). Adding that to the chart gave me this:
let highRiskMetrics = materialize(
customMetrics
| where name == "Password.Breached" or (name == "User.Login" and customDimensions["Result"] != "Success") or name == "User.2FAChallenge"
// summarize our high-risk metric on a 1 minute interval
| make-series valueSum = sum(valueCount) on timestamp step 1m
// detect anomalies over our sum value, using a k-value of 4, over buckets amounting to one day, skipping trend analysis
| extend (anomalies, score, baseline) = series_decompose_anomalies(valueSum, 4, toint(1d/1m), 'none')
// expand our new anomalies series
| mv-expand timestamp, anomalies
// project the data for filtering in Grafana
| project timestamp = todatetime(timestamp), anomalies = toint(anomalies));

highRiskMetrics
| where $__timeFilter()
| summarize Anomaly = max(anomalies) by bin(timestamp, $__interval)
| order by timestamp asc
The Application Insights query for the anomaly detection
What this query does is take our high-risk metrics, detect trends and baselines on a 1 minute basis, with a seasonality of 24 hours.
Putting this all together we could then create a Grafana alert, which triggers if we see the anomaly being triggered for a given amount of time, giving is near-real-time notifications and react once we see credential stuffing attacks.
This is still a work in progress, but initial tests are extremely hopeful, with few false positives and looking at historical data we have even been able to spot smaller credential stuffing attacks that we missed, so this is most certainly something we'll keep around and iterate on.