
Autoscaling Azure SQL HyperScale for better cost management

Troy Hunt has written before about how Have I Been Pwned runs in the cloud, but I wanted to do a little more of a deep dive on how we try to manage our Azure SQL HyperScale cloud costs. We use Azure SQL HyperScale to store all the breach data for Have I Been Pwned and it currently sits at just over 1 Terabyte of data which is constantly being queried by users through the website or the API.
One of the things we saw early on with Azure SQL HyperScale is that while we are loading data breaches we often need to scale the DB up and then scale it back down once we have loaded the data. We scale down because the Have I Been Pwned data is very static and only really changes when we actually load new data breaches, so we extensively cache things on the Cloudflare Edge using their workers.
Now, you might be wondering why we don't just leave the core count for Azure SQL up there, since it's just a max setting and it should be cheaper if we aren't using all the cores anyway. That's what the docs say right?
We figured we could just as well keep the core count up and since we weren't using all of them we'd only be billed for the CPU cores used.
Apparently we were wrong! But we couldn't figure out why the bills weren't going down so we started digging deeper.
We were seeing utilization for a 40 vCore instance in the low 10-20% ranges so we expected to be billed for some 4 - 8 cores used but we were being billed constantly for all 40 cores. How could that be? That's when I started really looking into the billing for HyperScale and my eyes stopped at this line:
Amount billed: vCore unit price * maximum (minimum vCores, vCores used, minimum memory GB * 1/3, memory GB used * 1/3)
After my brain processed that single line a bit i dawned on us...
Well ain't that sneaky! For a service like ours where data is always beeing queried and since SQL Server by default uses all the memory it has to cache data, the maximum of that is ALWAYS going to be "(memory GB used * 1/3)". This was confirmed when we looked at the Memory % Used graphs which pretty much constantly look like this:
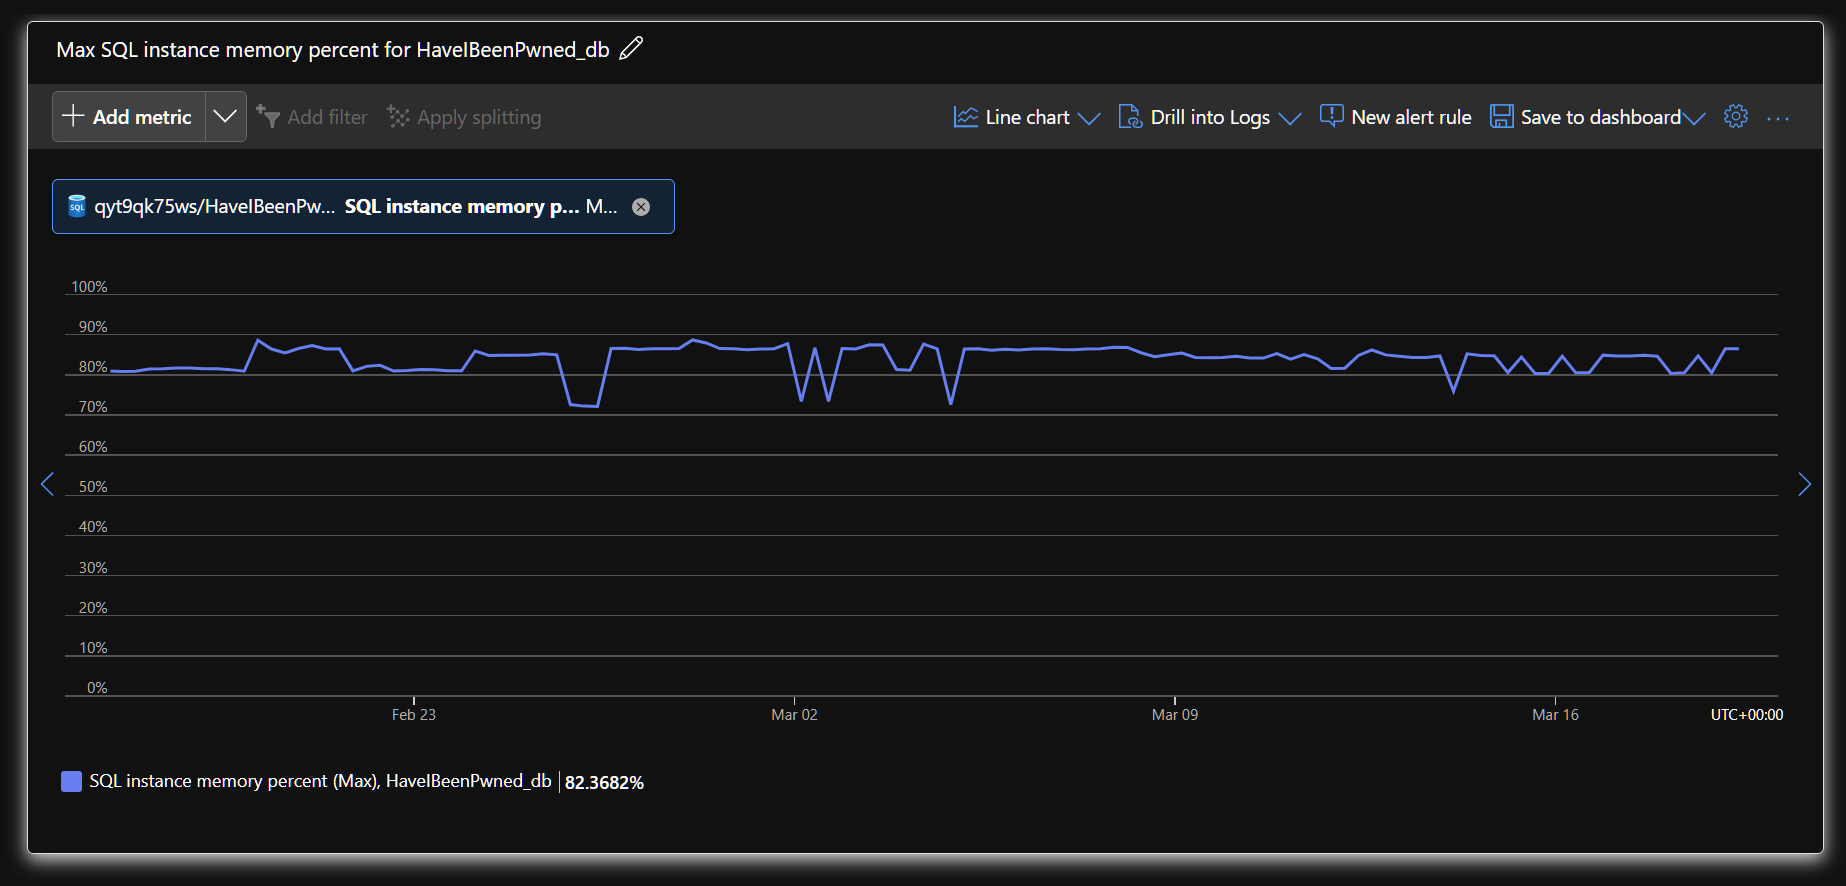
Since our memory utilization is pretty much always maxed, we are always billed for the max vCores regardless of our actual vCore usage.
Again...
If your HyperScale server is querying a lot of data from your DB, you will be billed for the max vCore it is configured for regardless of your actual vCore usage, because you will be using all the available memory in SQL Server due to how the SQL Server cache works.
Ok, now that we made that discovery, how can we manage the max vCore configuration? Azure SQL does not have anything like Azure App Service autoscaling to scale core counts up and down based on load. That's when I found out that you can scale Azure SQL HyperScale with a SQL command!
-- Set the HyperScale DB to 8 vCores max
ALTER DATABASE <database_name> MODIFY (SERVICE_OBJECTIVE = 'HS_S_Gen5_8');
Ok, but how do we know when it's safe for us to scale things up and down then? Easy! You can also query performance counters for the SQL instance! So, we decided that we'd write a few procs to query this data and depending on the state of the DB we could determine if we should scale the database up/down or not do anything. So, we came up with this script!
CREATE PROCEDURE [dbo].[ScaleDatabase]
  @CoreCount              INT   = NULL, @CpuScaleUpThreshold FLOAT = 60, @CpuScaleDownThreshold FLOAT = 20,
  @WorkerScaleUpThreshold FLOAT = 10, @WorkerScaleDownThreshold FLOAT = 5, @MinutesToEvaluate INT = 5
AS
BEGIN
  -- Let's first check if we are allowed to scale
  DECLARE @IsSet BIT
  EXEC dbo.GetHibpFlag 'ScaleLocked', @IsSet OUTPUT
  IF @IsSet = 1
  BEGIN
    EXEC dbo.LogScalingEvent @Message = 'Scaling is locked. Not doing anything this time.'
    RETURN
  END

  -- Get the current workload
  DECLARE @currentWorkload NVARCHAR(20) = CAST(DATABASEPROPERTYEX(DB_NAME(), 'ServiceObjective') AS NVARCHAR),
    @nextWorkload          NVARCHAR(20) = NULL, @logMessage NVARCHAR(1000) = NULL

  PRINT 'Current workload: ' + @currentWorkload
  DECLARE @ScaleCommand NVARCHAR(1000)

  -- If the CoreCount is not provided, we will use automatic scaling
  IF @CoreCount IS NULL
  BEGIN
    -- Automatic scaling
    DECLARE @StartDate DATETIME = DATEADD(MINUTE, -@MinutesToEvaluate, GETUTCDATE())
    DECLARE @StartTime DATETIME, @EndTime DATETIME, @AvgCpuPercent FLOAT, @MaxWorkerPercent FLOAT, @ScaleUp BIT,
      @ScaleDown       BIT, @DataPoints INT;

    WITH DbStats (TimeStamp, AvgCpuPercent, MaxWorkerPercent, ScaleUp, ScaleDown)
    AS
    (
      SELECT [TimeStamp] = [end_time], AvgCpuPercent = [avg_cpu_percent], MaxWorkerPercent = [max_worker_percent],
        -- If the CPU OR Worker percentage exceeds the scale up threshold, increment the ScaleUp counter
        ScaleUp = IIF([avg_cpu_percent] > @CpuScaleUpThreshold OR [max_worker_percent] > @WorkerScaleUpThreshold,
                  1.0,
                  0.0),
        -- If the CPU AND Worker percentage are below the scale down threshold, increment the ScaleDown counter
        ScaleDown = IIF([avg_cpu_percent] < @CpuScaleDownThreshold AND [max_worker_percent] < @WorkerScaleDownThreshold,
                    1.0,
                    0.0)
        FROM sys.dm_db_resource_stats s
    )
    SELECT @StartTime = MIN(TimeStamp), @EndTime = MAX(TimeStamp), @AvgCpuPercent = AVG(AvgCpuPercent),
      @MaxWorkerPercent = MAX(MaxWorkerPercent), @ScaleUp = CONVERT(BIT, ROUND(MAX(ScaleUp), 0)),
      @ScaleDown = CONVERT(BIT, ROUND(MIN(ScaleDown), 0)), @DataPoints = COUNT(*)
      FROM DbStats
     WHERE TimeStamp BETWEEN @StartDate AND GETUTCDATE()

    DECLARE @EndDate DATETIME = DATEADD(MINUTE, 10, GETUTCDATE())
    IF @ScaleUp = 1
    BEGIN
      EXEC dbo.GetNextScaleWorkload 1, @nextWorkload OUTPUT
      IF @nextWorkload IS NULL
      BEGIN
        SELECT @logMessage = N'Already at highest scale. Not doing anything this time.'
        EXEC dbo.LogScalingEvent @Message = @logMessage
      END
      ELSE
      BEGIN
        SELECT @logMessage = CONCAT(
                               'Scaling up from ',
                               @currentWorkload,
                               ' to ',
                               @nextWorkload,
                               ' due to high CPU or worker utilization (CPU: ',
                               FORMAT(@AvgCpuPercent, 'N2'),
                               '%, Workers: ',
                               FORMAT(@MaxWorkerPercent, 'N2'),
                               '%)')
        SELECT @ScaleCommand = CONCAT(
                                 'ALTER DATABASE ', DB_NAME(), ' MODIFY (SERVICE_OBJECTIVE = ''', @nextWorkload, ''')')
        EXEC dbo.SetHibpFlag 'ScaleLocked', 1, @EndDate
        EXEC sp_executesql @ScaleCommand
        EXEC dbo.LogScalingEvent @Message = @logMessage
      END
    END
    ELSE IF @ScaleDown = 1
    BEGIN
      EXEC dbo.GetNextScaleWorkload 0, @nextWorkload OUTPUT
      IF @nextWorkload IS NULL
      BEGIN
        SELECT @logMessage = N'Already at lowest scale. Not doing anything this time.'
        EXEC dbo.LogScalingEvent @Message = @logMessage
      END
      ELSE
      BEGIN
        SELECT @logMessage = CONCAT(
                               'Scaling down from ',
                               @currentWorkload,
                               ' to ',
                               @nextWorkload,
                               ' due to low utilization (CPU: ',
                               FORMAT(@AvgCpuPercent, 'N2'),
                               '%, Workers: ',
                               FORMAT(@MaxWorkerPercent, 'N2'),
                               '%)')
        SELECT @ScaleCommand = CONCAT(
                                 'ALTER DATABASE ', DB_NAME(), ' MODIFY (SERVICE_OBJECTIVE = ''', @nextWorkload, ''')')
        EXEC dbo.SetHibpFlag 'ScaleLocked', 1, @EndDate
        EXEC sp_executesql @ScaleCommand
        EXEC dbo.LogScalingEvent @Message = @logMessage
      END
    END
    ELSE
    BEGIN
      SELECT @logMessage = CONCAT(
                             'No scaling action taken. CPU: ',
                             FORMAT(@AvgCpuPercent, 'N2'),
                             '%, Worker: ',
                             FORMAT(@MaxWorkerPercent, 'N2'),
                             '%. Current workload: ',
                             @currentWorkload)
      EXEC dbo.LogScalingEvent @Message = @logMessage
    END
  END
  ELSE
  BEGIN
    -- Manual scaling
    SELECT @nextWorkload = Workload
      FROM dbo.ScaleWorkloads
     WHERE Cores = @CoreCount

    IF @nextWorkload IS NULL
    BEGIN
      EXEC dbo.LogScalingEvent @Message = 'Invalid core count provided. No action taken.'
      RETURN
    END
    ELSE
    BEGIN
      SELECT @logMessage = CONCAT('Manually scaling from ', @currentWorkload, ' to ', @nextWorkload)
      SELECT @ScaleCommand = CONCAT(
                               'ALTER DATABASE ', DB_NAME(), ' MODIFY (SERVICE_OBJECTIVE = ''', @nextWorkload, ''')')
      EXEC sp_executesql @ScaleCommand
      EXEC dbo.LogScalingEvent @Message = @logMessage
    END
  END
END
GO
What this script basically does, is look at the performance data we have for a time period, and depending on the provided thresholds, will scale the HyperScale database up or down. It'll also give the DB time to stabilize after scaling operations by locking the scale for about 10 minutes after scaling events. We can configure all of this by sending different parameters as we iterate on this to find our optimal configuration.
However, there was one more problem. Azure SQL HyperScale does not support SQL Agent jobs so there is no built-in way to run this automatically or on a schedule. However, Azure does provide a service called Elastic Jobs which can run SQL statements against SQL databases on a schedule. Perfect!
So we created an elastic job to run the stored procedure every minute. Here is an example of what the logging output looks like:
| Timestamp | Message |
|---|---|
| 2025-03-19 07:13:07.413 | No scaling action taken. CPU: 24.17%, Worker: 1.55%. Current workload: HS_S_Gen5_18 |
| 2025-03-19 07:12:07.640 | No scaling action taken. CPU: 24.32%, Worker: 3.11%. Current workload: HS_S_Gen5_18 |
| 2025-03-19 07:11:07.290 | Scaling is locked. Not doing anything this time. |
| 2025-03-19 07:10:07.270 | Scaling is locked. Not doing anything this time. |
| 2025-03-19 07:09:07.350 | Scaling is locked. Not doing anything this time. |
| 2025-03-19 07:08:07.377 | Scaling is locked. Not doing anything this time. |
| 2025-03-19 07:07:07.427 | Scaling is locked. Not doing anything this time. |
| 2025-03-19 07:06:07.500 | Scaling is locked. Not doing anything this time. |
| 2025-03-19 07:05:07.090 | Scaling is locked. Not doing anything this time. |
| 2025-03-19 07:04:07.150 | Scaling is locked. Not doing anything this time. |
| 2025-03-19 07:03:17.707 | Scaling is locked. Not doing anything this time. |
| 2025-03-19 07:02:07.127 | Scaling down from HS_S_Gen5_20 to HS_S_Gen5_18 due to low utilization (CPU: 17.89%, Workers: 1.26%) |
| 2025-03-19 07:01:06.770 | No scaling action taken. CPU: 17.95%, Worker: 1.26%. Current workload: HS_S_Gen5_20 |
| 2025-03-19 07:00:06.717 | No scaling action taken. CPU: 17.92%, Worker: 1.26%. Current workload: HS_S_Gen5_20 |
Here we see the procedure decide to automatically scale the max vCores down from 20 to 18 due to low CPU and worker utilization. Success!
This has made our lives a lot easier, although I do wish that Azure SQL HyperScale had a way to do this automatically.
Hope this helps!