
Monitoring GC and memory allocations with .NET Core 2.2 and Application Insights
With the new event source in .NET Core 2.2, a whole heap of diagnostics information can now be gathered in-process which can help you to gather information about your application behavior and to help you troubleshoot issues.

Introduction
Well that title was a mouthful, but we have some very interesting stuff in this blog post, at least in my opinion :)
It all started when we were migrating some of our service from .NET Framework to .NET Core. We have been using Application Insights, using it's performance counter collection feature to monitor performance counters on our Windows server that run our applications. We soon discovered when we moved over to .NET Core that we'd have to do things differently, since performance counters aren't supported in Application Insights for .NET Core.
Getting the data
The things we monitor are for example the number of GC collections by generation, working set, CPU usage etc. and I needed a way to get the same information from within our application, as we like to do this in-process for simplicity reasons (yes, I'm aware that this does have a performance impact, more on that later).
I poked a few people on Twitter for help and soon received this response from David Fowler (@davidfowl).
You can use the new runtime event source in 2.2 to get Rutime events.
— David Fowler (@davidfowl) December 21, 2018
To my surprise and jubilation it seems that as of .NET Core 2.2, a lot of the .NET Runtime events for things like GC, JIT and more are now being published as an Event Source, and best of all, IT WORKS CROSS PLATFORM!
I started with the simple example at https://medium.com/criteo-labs/c-in-process-clr-event-listeners-with-net-core-2-2-ef4075c14e87 and then adapted it a bit.
What I did was create a couple of IHostedService background tasks, one to monitor the GC events, and one to monitor CPU and memory usage. I then use the Application Insights API and post the metrics to Application Insights using their awesome Metric functionality. This of course could just as well be sending the data to New Relic, Prometheus or whatever floats your metric boats :)
For information about the GC events, check this link: https://docs.microsoft.com/en-us/dotnet/framework/performance/garbage-collection-etw-events
Code
Here is the GC collector and GC event listener:
using System;
using System.Diagnostics.Tracing;
using Microsoft.ApplicationInsights;
using Microsoft.ApplicationInsights.Metrics;

namespace CCP.ApplicationInsights.PerformanceCollector
{
    public class GcEventsCollector : IHostedService, IDisposable
    {
        private readonly IOptions<CisSettings> _settings;
        private readonly TelemetryClient _telemetryClient;
        private Timer _timer;
        private Metric _gen0Collections;
        private Metric _gen1Collections;
        private Metric _gen2Collections;
        private Metric _totalMemory;
        private GcEventListener _gcTest;

        public GcEventsCollector(IOptions<CisSettings> settings, TelemetryClient telemetryClient)
        {
            _settings = settings;
            _telemetryClient = telemetryClient;
        }

        public void Dispose()
        {
            _timer?.Dispose();
            _gcTest?.Dispose();
        }

        public Task StartAsync(CancellationToken cancellationToken)
        {
            if (_settings.Value.GcEventsCollector.Enabled)
            {
                const string MetricNamespace = "dotnet.gc";
                _gen0Collections = _telemetryClient.GetMetric(new MetricIdentifier(MetricNamespace, "Gen 0 Collections"));
                _gen1Collections = _telemetryClient.GetMetric(new MetricIdentifier(MetricNamespace, "Gen 1 Collections"));
                _gen2Collections = _telemetryClient.GetMetric(new MetricIdentifier(MetricNamespace, "Gen 2 Collections"));
                _totalMemory = _telemetryClient.GetMetric(new MetricIdentifier(MetricNamespace, "Total Memory"));

                _timer = new Timer(CollectData, null, 0, 5000);
                _gcTest = new GcEventListener(_telemetryClient, _settings.Value.GcEventsCollector.EnableAllocationEvents);
            }

            return Task.CompletedTask;
        }

        private void CollectData(object state)
        {
            _gen0Collections.TrackValue(GC.CollectionCount(0));
            _gen1Collections.TrackValue(GC.CollectionCount(1));
            _gen2Collections.TrackValue(GC.CollectionCount(2));
            _totalMemory.TrackValue(GC.GetTotalMemory(false));
        }

        public Task StopAsync(CancellationToken cancellationToken)
        {
            _timer?.Change(Timeout.Infinite, Timeout.Infinite);
            return Task.CompletedTask;
        }
    }

    sealed class GcEventListener : EventListener
    {
        // from https://docs.microsoft.com/en-us/dotnet/framework/performance/garbage-collection-etw-events
        private const int GC_KEYWORD = 0x0000001;
        private readonly TelemetryClient _client;
        private readonly Metric _allocatedMemory;
        private readonly Metric _gen0Size;
        private readonly Metric _gen1Size;
        private readonly Metric _gen2Size;
        private readonly Metric _lohSize;
        private readonly Metric _gen0Promoted;
        private readonly Metric _gen1Promoted;
        private readonly Metric _gen2Survived;
        private readonly Metric _lohSurvived;
        private EventSource _dotNetRuntime;
        private readonly EventLevel _eventLevel;

        public GcEventListener(TelemetryClient client, bool enableAllocationEvents = false)
        {
            _client = client ?? throw new ArgumentNullException(nameof(client));

            const string MetricNamespace = "dotnet.gc";
            _gen0Size = _client.GetMetric(new MetricIdentifier(MetricNamespace, "Gen 0 Heap Size"));
            _gen1Size = _client.GetMetric(new MetricIdentifier(MetricNamespace, "Gen 1 Heap Size"));
            _gen2Size = _client.GetMetric(new MetricIdentifier(MetricNamespace, "Gen 2 Heap Size"));
            _lohSize = _client.GetMetric(new MetricIdentifier(MetricNamespace, "Large Object Heap Size"));
            _gen0Promoted = _client.GetMetric(new MetricIdentifier(MetricNamespace, "Bytes Promoted From Gen 0"));
            _gen1Promoted = _client.GetMetric(new MetricIdentifier(MetricNamespace, "Bytes Promoted From Gen 1"));
            _gen2Survived = _client.GetMetric(new MetricIdentifier(MetricNamespace, "Bytes Survived Gen 2"));
            _allocatedMemory = _client.GetMetric(new MetricIdentifier(MetricNamespace, "Allocated Memory", "Type"));
            _lohSurvived = _client.GetMetric(new MetricIdentifier(MetricNamespace, "Bytes Survived Large Object Heap"));

            _eventLevel = enableAllocationEvents ? EventLevel.Verbose : EventLevel.Informational;
        }

        protected override void OnEventSourceCreated(EventSource eventSource)
        {
            // look for .NET Garbage Collection events
            if (eventSource.Name.Equals("Microsoft-Windows-DotNETRuntime"))
            {
                _dotNetRuntime = eventSource;
                // EventLevel.Verbose enables the AllocationTick events, but also a heap of other stuff and will increase the memory allocation of your application since it's a lot of data to digest. EventLevel.Information is more light weight and is recommended if you don't need the allocation data.
                EnableEvents(eventSource, EventLevel.Verbose, (EventKeywords)GC_KEYWORD);
            }
        }

        // from https://blogs.msdn.microsoft.com/dotnet/2018/12/04/announcing-net-core-2-2/
        // Called whenever an event is written.
        protected override void OnEventWritten(EventWrittenEventArgs eventData)
        {
            switch (eventData.EventName)
            {
                case "GCHeapStats_V1":
                    ProcessHeapStats(eventData);
                    break;
                case "GCAllocationTick_V3":
                    ProcessAllocationEvent(eventData);
                    break;
            }
        }

        private void ProcessAllocationEvent(EventWrittenEventArgs eventData)
        {
            _allocatedMemory.TrackValue((ulong)eventData.Payload[3], (string)eventData.Payload[5]);
        }

        private void ProcessHeapStats(EventWrittenEventArgs eventData)
        {
            _gen0Size.TrackValue((ulong)eventData.Payload[0]);
            _gen0Promoted.TrackValue((ulong)eventData.Payload[1]);
            _gen1Size.TrackValue((ulong)eventData.Payload[2]);
            _gen1Promoted.TrackValue((ulong)eventData.Payload[3]);
            _gen2Size.TrackValue((ulong)eventData.Payload[4]);
            _gen2Survived.TrackValue((ulong)eventData.Payload[5]);
            _lohSize.TrackValue((ulong)eventData.Payload[6]);
            _lohSurvived.TrackValue((ulong)eventData.Payload[7]);
        }
    }
}
And here is the CPU and Memory usage collector:
using System;
using System.Diagnostics;
using System.Threading;
using System.Threading.Tasks;
using CCP.CustomerInformationService;
using Microsoft.ApplicationInsights;
using Microsoft.ApplicationInsights.Metrics;
using Microsoft.Extensions.Hosting;
using Microsoft.Extensions.Options;

namespace CCP.ApplicationInsights.PerformanceCollector
{
    public class SystemUsageCollector : IHostedService, IDisposable
    {
        private readonly IOptions<CisSettings> _settings;
        private readonly TelemetryClient _telemetryClient;
        private Timer _timer;
        private Metric _totalCpuUsed;
        private Metric _privilegedCpuUsed;
        private Metric _userCpuUsed;
        private Metric _workingSet;
        private Metric _nonPagedSystemMemory;
        private Metric _pagedMemory;
        private Metric _pagedSystemMemory;
        private Metric _privateMemory;
        private Metric _virtualMemoryMemory;
        private readonly Process _process = Process.GetCurrentProcess();
        private DateTime _lastTimeStamp;
        private TimeSpan _lastTotalProcessorTime = TimeSpan.Zero;
        private TimeSpan _lastUserProcessorTime = TimeSpan.Zero;
        private TimeSpan _lastPrivilegedProcessorTime = TimeSpan.Zero;

        public SystemUsageCollector(IOptions<CisSettings> settings, TelemetryClient telemetryClient)
        {
            _settings = settings;
            _telemetryClient = telemetryClient;
            _lastTimeStamp = _process.StartTime;
        }

        public void Dispose()
        {
            _timer?.Dispose();
        }

        public Task StartAsync(CancellationToken cancellationToken)
        {
            if (_settings.Value.SystemUsageCollector.Enabled)
            {
                _totalCpuUsed = _telemetryClient.GetMetric(new MetricIdentifier("system.cpu", "Total % Used"));
                _privilegedCpuUsed = _telemetryClient.GetMetric(new MetricIdentifier("system.cpu", "Privileged % Used"));
                _userCpuUsed = _telemetryClient.GetMetric(new MetricIdentifier("system.cpu", "User % Used"));
                _workingSet = _telemetryClient.GetMetric(new MetricIdentifier("system.memory", "Working Set"));
                _nonPagedSystemMemory = _telemetryClient.GetMetric(new MetricIdentifier("system.memory", "Non-Paged System Memory"));
                _pagedMemory = _telemetryClient.GetMetric(new MetricIdentifier("system.memory", "Paged Memory"));
                _pagedSystemMemory = _telemetryClient.GetMetric(new MetricIdentifier("system.memory", "System Memory"));
                _privateMemory = _telemetryClient.GetMetric(new MetricIdentifier("system.memory", "Private Memory"));
                _virtualMemoryMemory = _telemetryClient.GetMetric(new MetricIdentifier("system.memory", "Virtual Memory"));

                _timer = new Timer(CollectData, null, 1000, 5000);
            }

            return Task.CompletedTask;
        }

        private void CollectData(object state)
        {
            double totalCpuTimeUsed = _process.TotalProcessorTime.TotalMilliseconds - _lastTotalProcessorTime.TotalMilliseconds;
            double privilegedCpuTimeUsed = _process.PrivilegedProcessorTime.TotalMilliseconds - _lastPrivilegedProcessorTime.TotalMilliseconds;
            double userCpuTimeUsed = _process.UserProcessorTime.TotalMilliseconds - _lastUserProcessorTime.TotalMilliseconds;

            _lastTotalProcessorTime = _process.TotalProcessorTime;
            _lastPrivilegedProcessorTime = _process.PrivilegedProcessorTime;
            _lastUserProcessorTime = _process.UserProcessorTime;

            double cpuTimeElapsed = (DateTime.UtcNow - _lastTimeStamp).TotalMilliseconds * Environment.ProcessorCount;
            _lastTimeStamp = DateTime.UtcNow;

            _totalCpuUsed.TrackValue(totalCpuTimeUsed * 100 / cpuTimeElapsed);
            _privilegedCpuUsed.TrackValue(privilegedCpuTimeUsed * 100 / cpuTimeElapsed);
            _userCpuUsed.TrackValue(userCpuTimeUsed * 100 / cpuTimeElapsed);

            _workingSet.TrackValue(_process.WorkingSet64);
            _nonPagedSystemMemory.TrackValue(_process.NonpagedSystemMemorySize64);
            _pagedMemory.TrackValue(_process.PagedMemorySize64);
            _pagedSystemMemory.TrackValue(_process.PagedSystemMemorySize64);
            _privateMemory.TrackValue(_process.PrivateMemorySize64);
            _virtualMemoryMemory.TrackValue(_process.VirtualMemorySize64);
        }

        public Task StopAsync(CancellationToken cancellationToken)
        {
            _timer?.Change(Timeout.Infinite, Timeout.Infinite);
            return Task.CompletedTask;
        }
    }
}
I then register these services in my ASP.NET Core Startup.cs like so
services.AddHostedService<SystemUsageCollector>();
services.AddHostedService<GcEventsCollector>();
and they will start doing their work once the app boots up. The awesome thing about the GC Event Source is that if you set the EventLevel to Verbose like in the example above, you can catch the Allocation Tick events. These are events that are triggered on approximately every 100.000 bytes allocated and they include the .NET Type that triggered the allocation threshold, so you can get an approximation of which objects are triggering allocations in your application. This will increase the number of events quite a bit, which also of course adds more allocations, but having this data is worth the impact on our case, as it gives us some pretty valuable insight into the behavior and performance of our application.
Querying our data using Application Insights
Gathering the data is one thing, but to make it useful we need to query it. Thankfully, Application Insights makes that really easy :) Here are a few examples of analytics queries we can make.
CPU usage by User and Privileged time
customMetrics
| where name in ("User % Used", "Privileged % Used")
| project timestamp, name, avgValue = valueSum / valueCount
| summarize CPU = avg(avgValue) by name, bin(timestamp, 5m)
| render areachart kind=stacked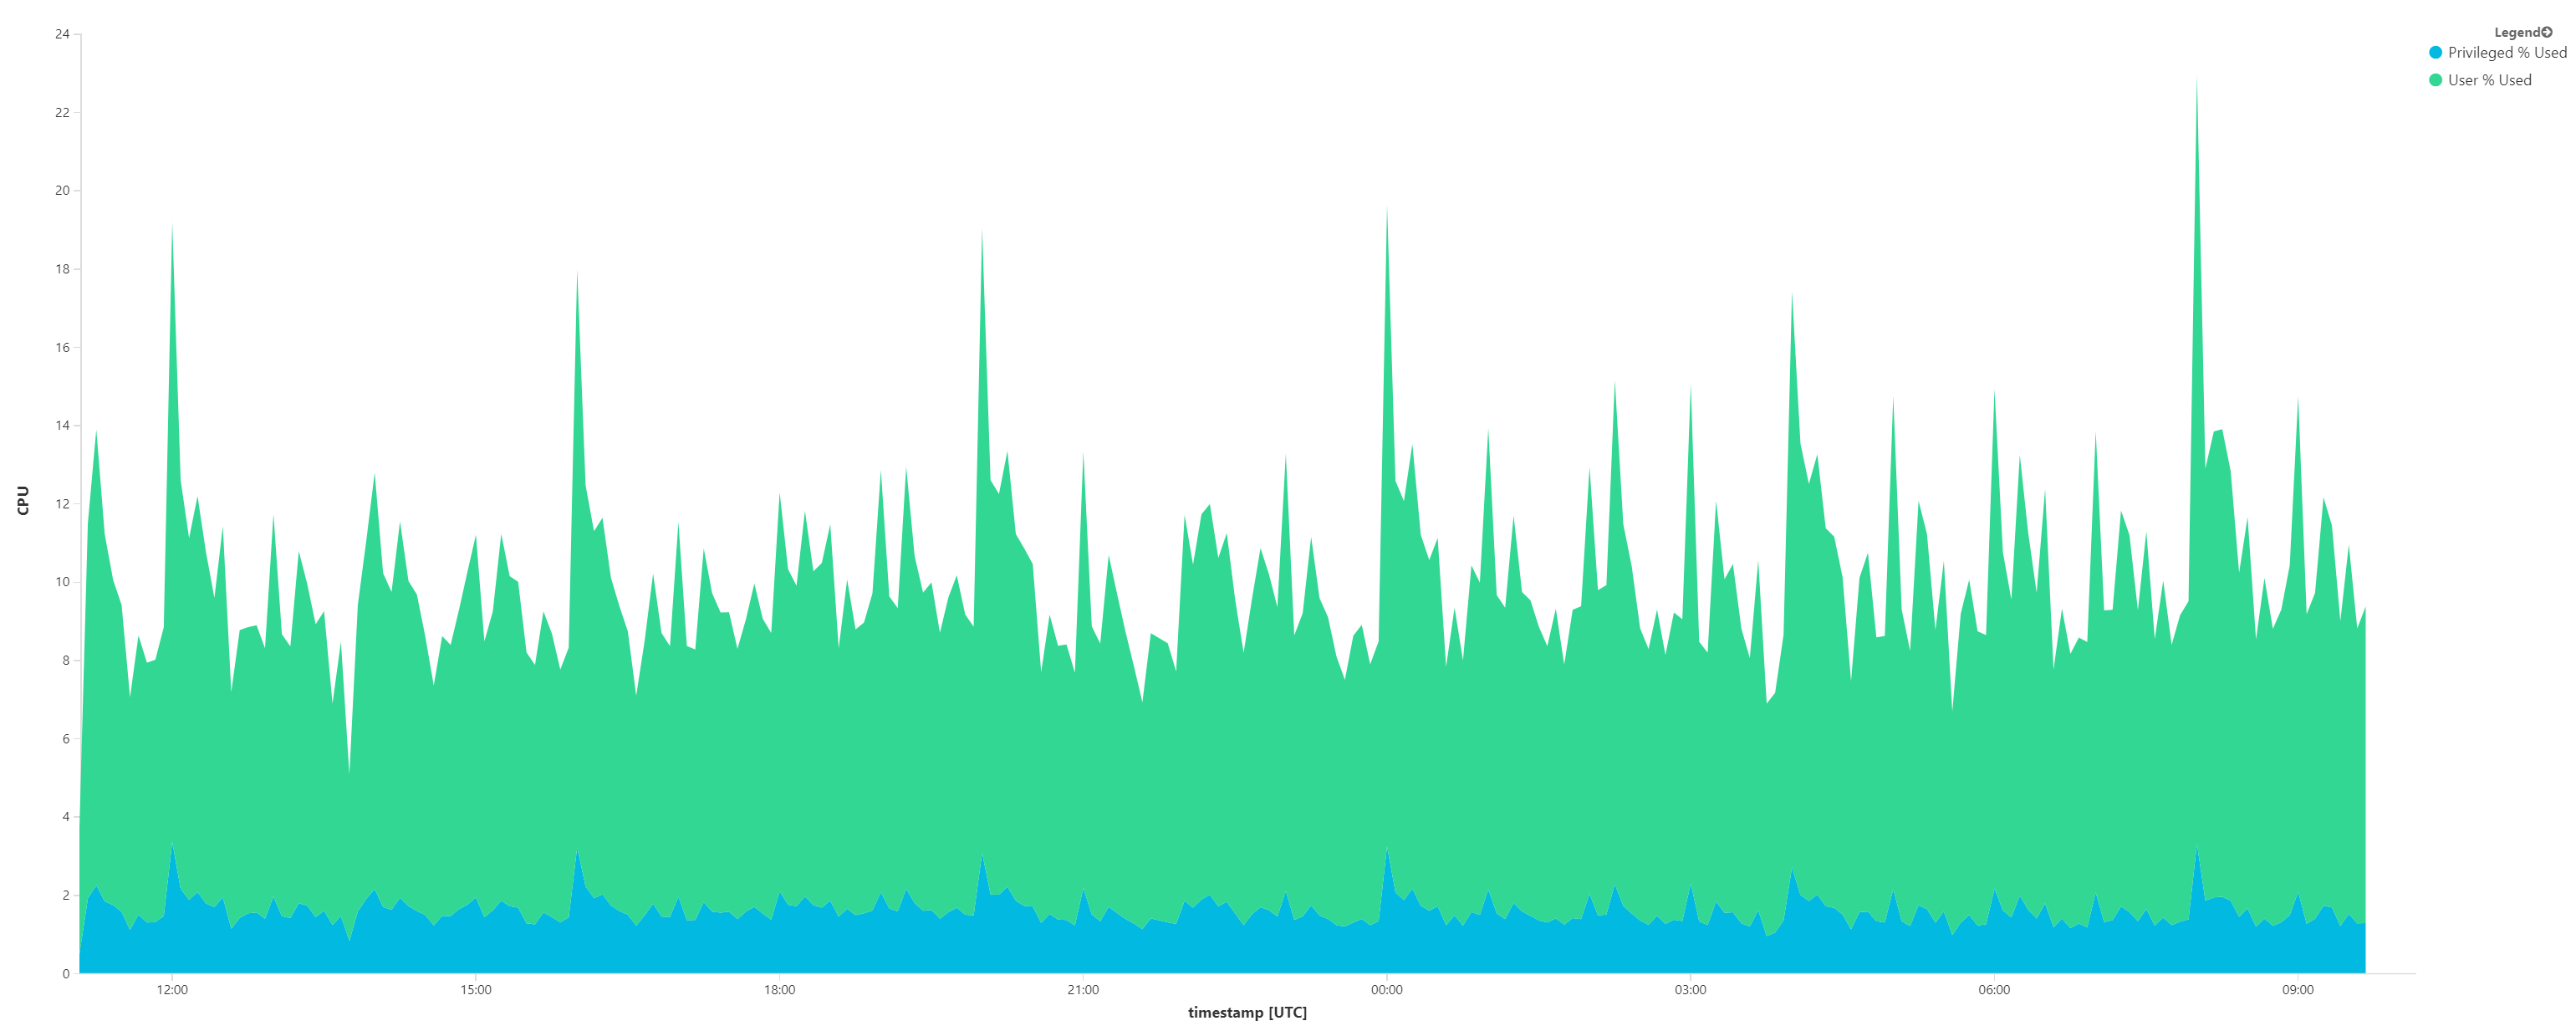
GC Heap Size by generation
customMetrics
| where name contains "Heap Size"
| order by cloud_RoleInstance, name, timestamp desc
| project timestamp, name, cloud_RoleInstance, avgValue = valueSum / valueCount
| summarize heapSize = avg(avgValue) by bin(timestamp, 5m), name
| render areachart kind=stacked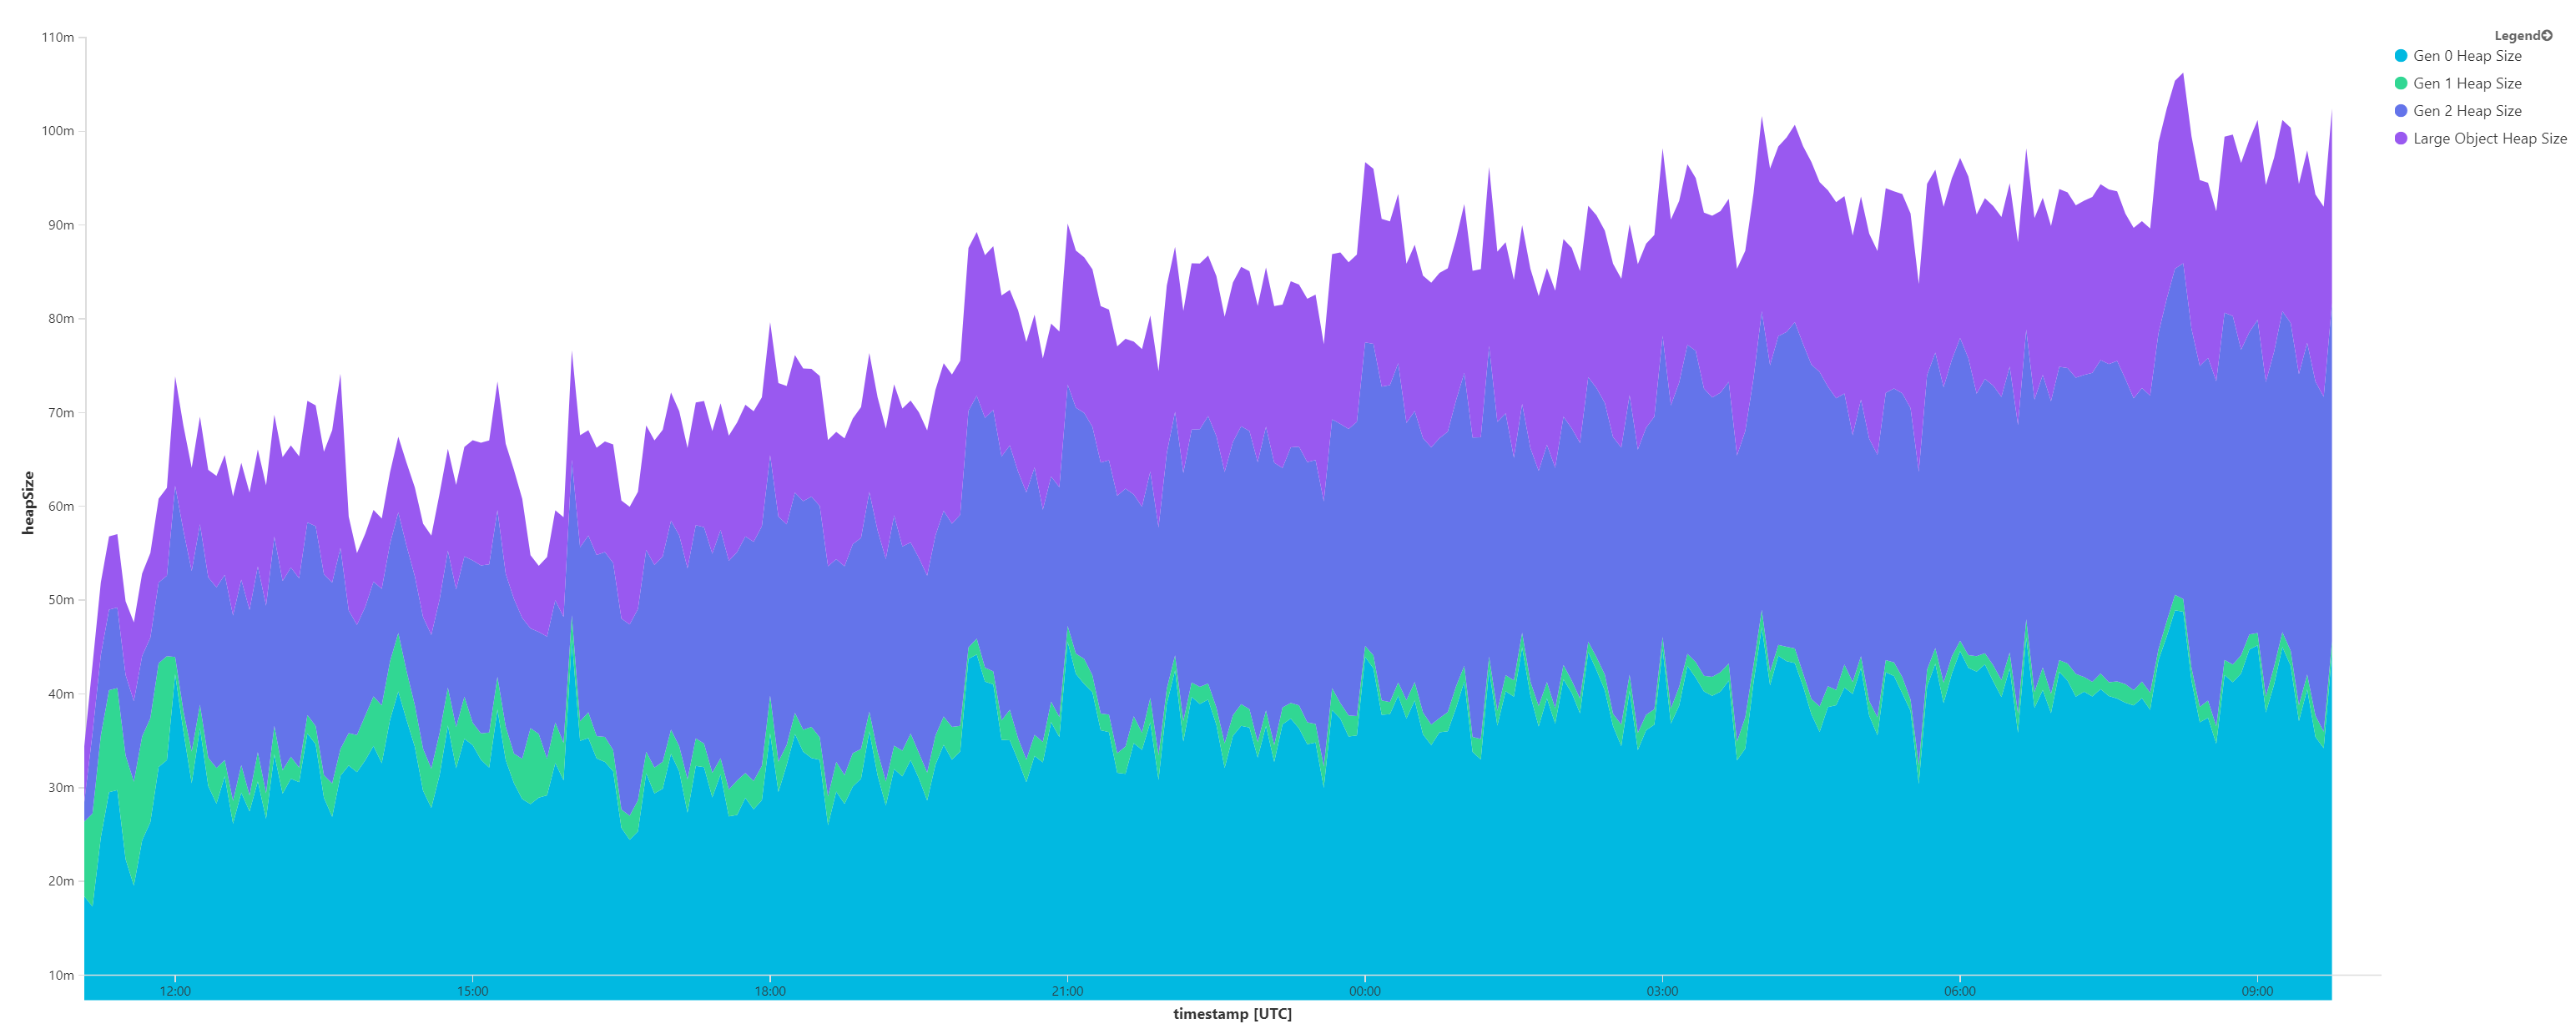
GC heap size changes over time (for a single server)
customMetrics
| where name contains "Heap Size" and cloud_RoleInstance == "SERVER_NAME"
| order by cloud_RoleInstance, name, timestamp desc
| project timestamp, name, cloud_RoleInstance, valueDiff = iff(cloud_RoleInstance == next(cloud_RoleInstance, 1) and name == next(name, 1), (valueSum / valueCount) - (next(valueSum, 1) / next(valueCount, 1)), 0.0)
| summarize heapSizeDiff = avg(valueDiff) by name, cloud_RoleInstance, bin(timestamp, 5m)
| render barchart kind=unstacked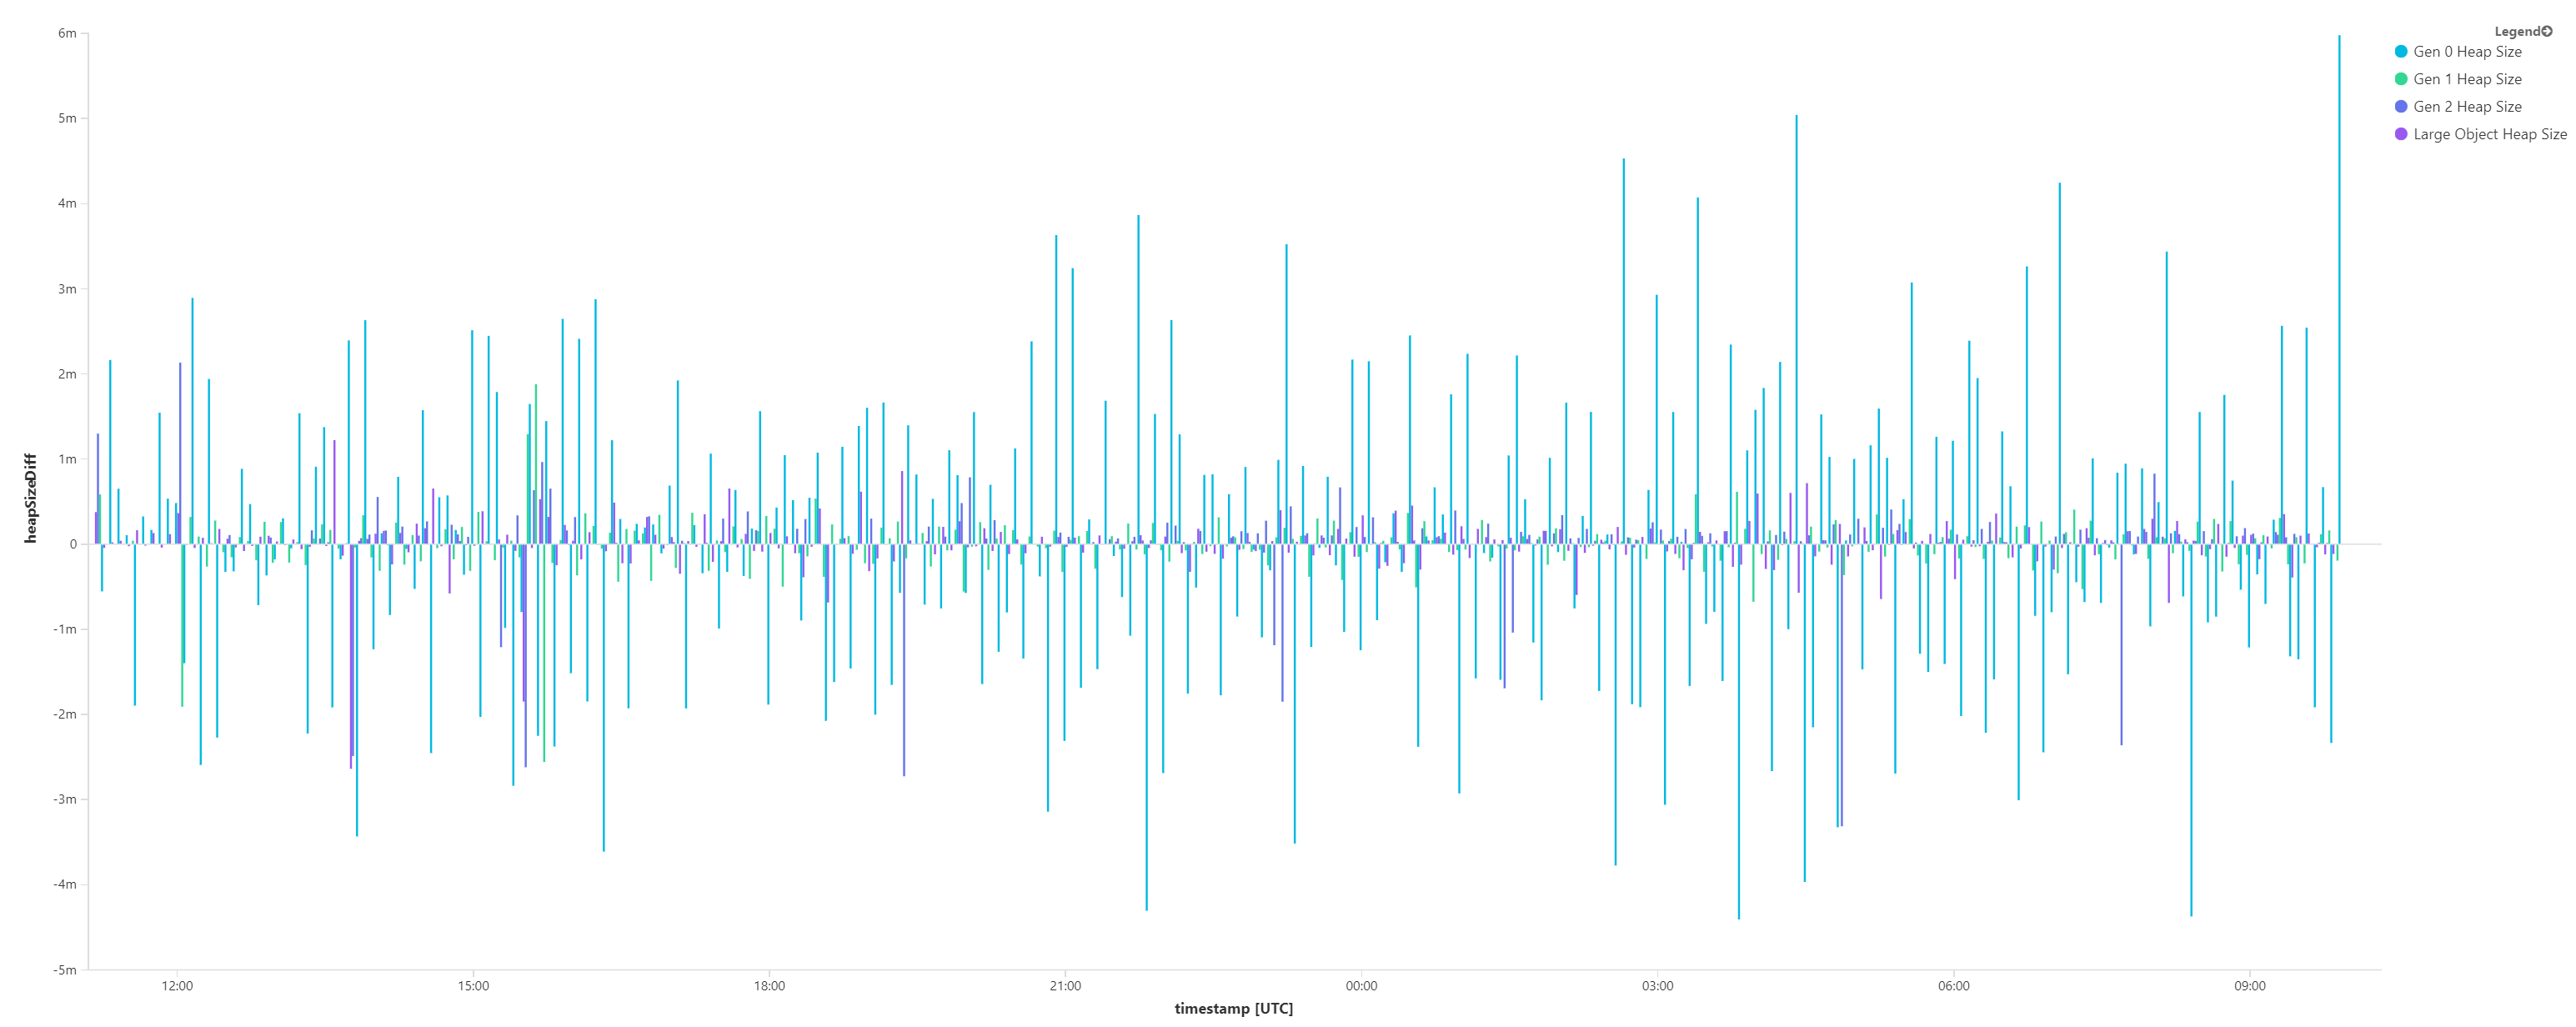
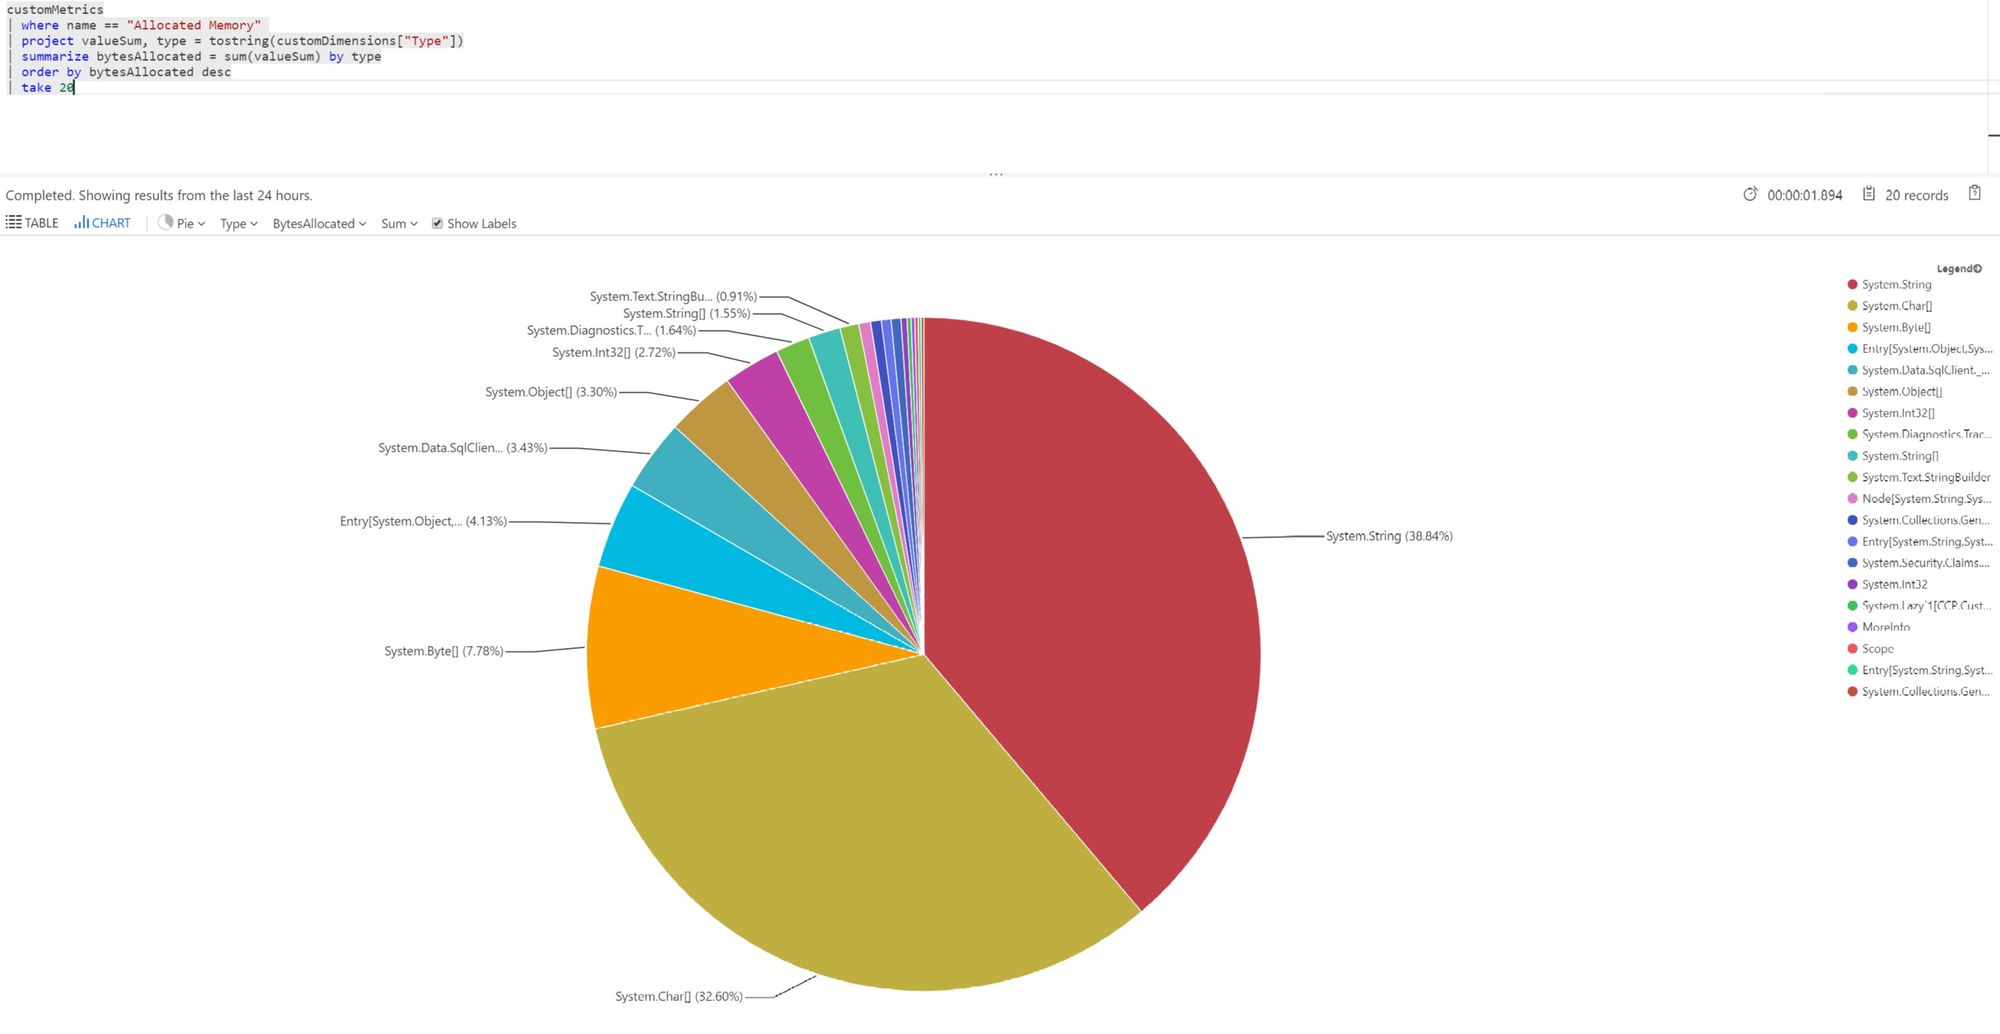
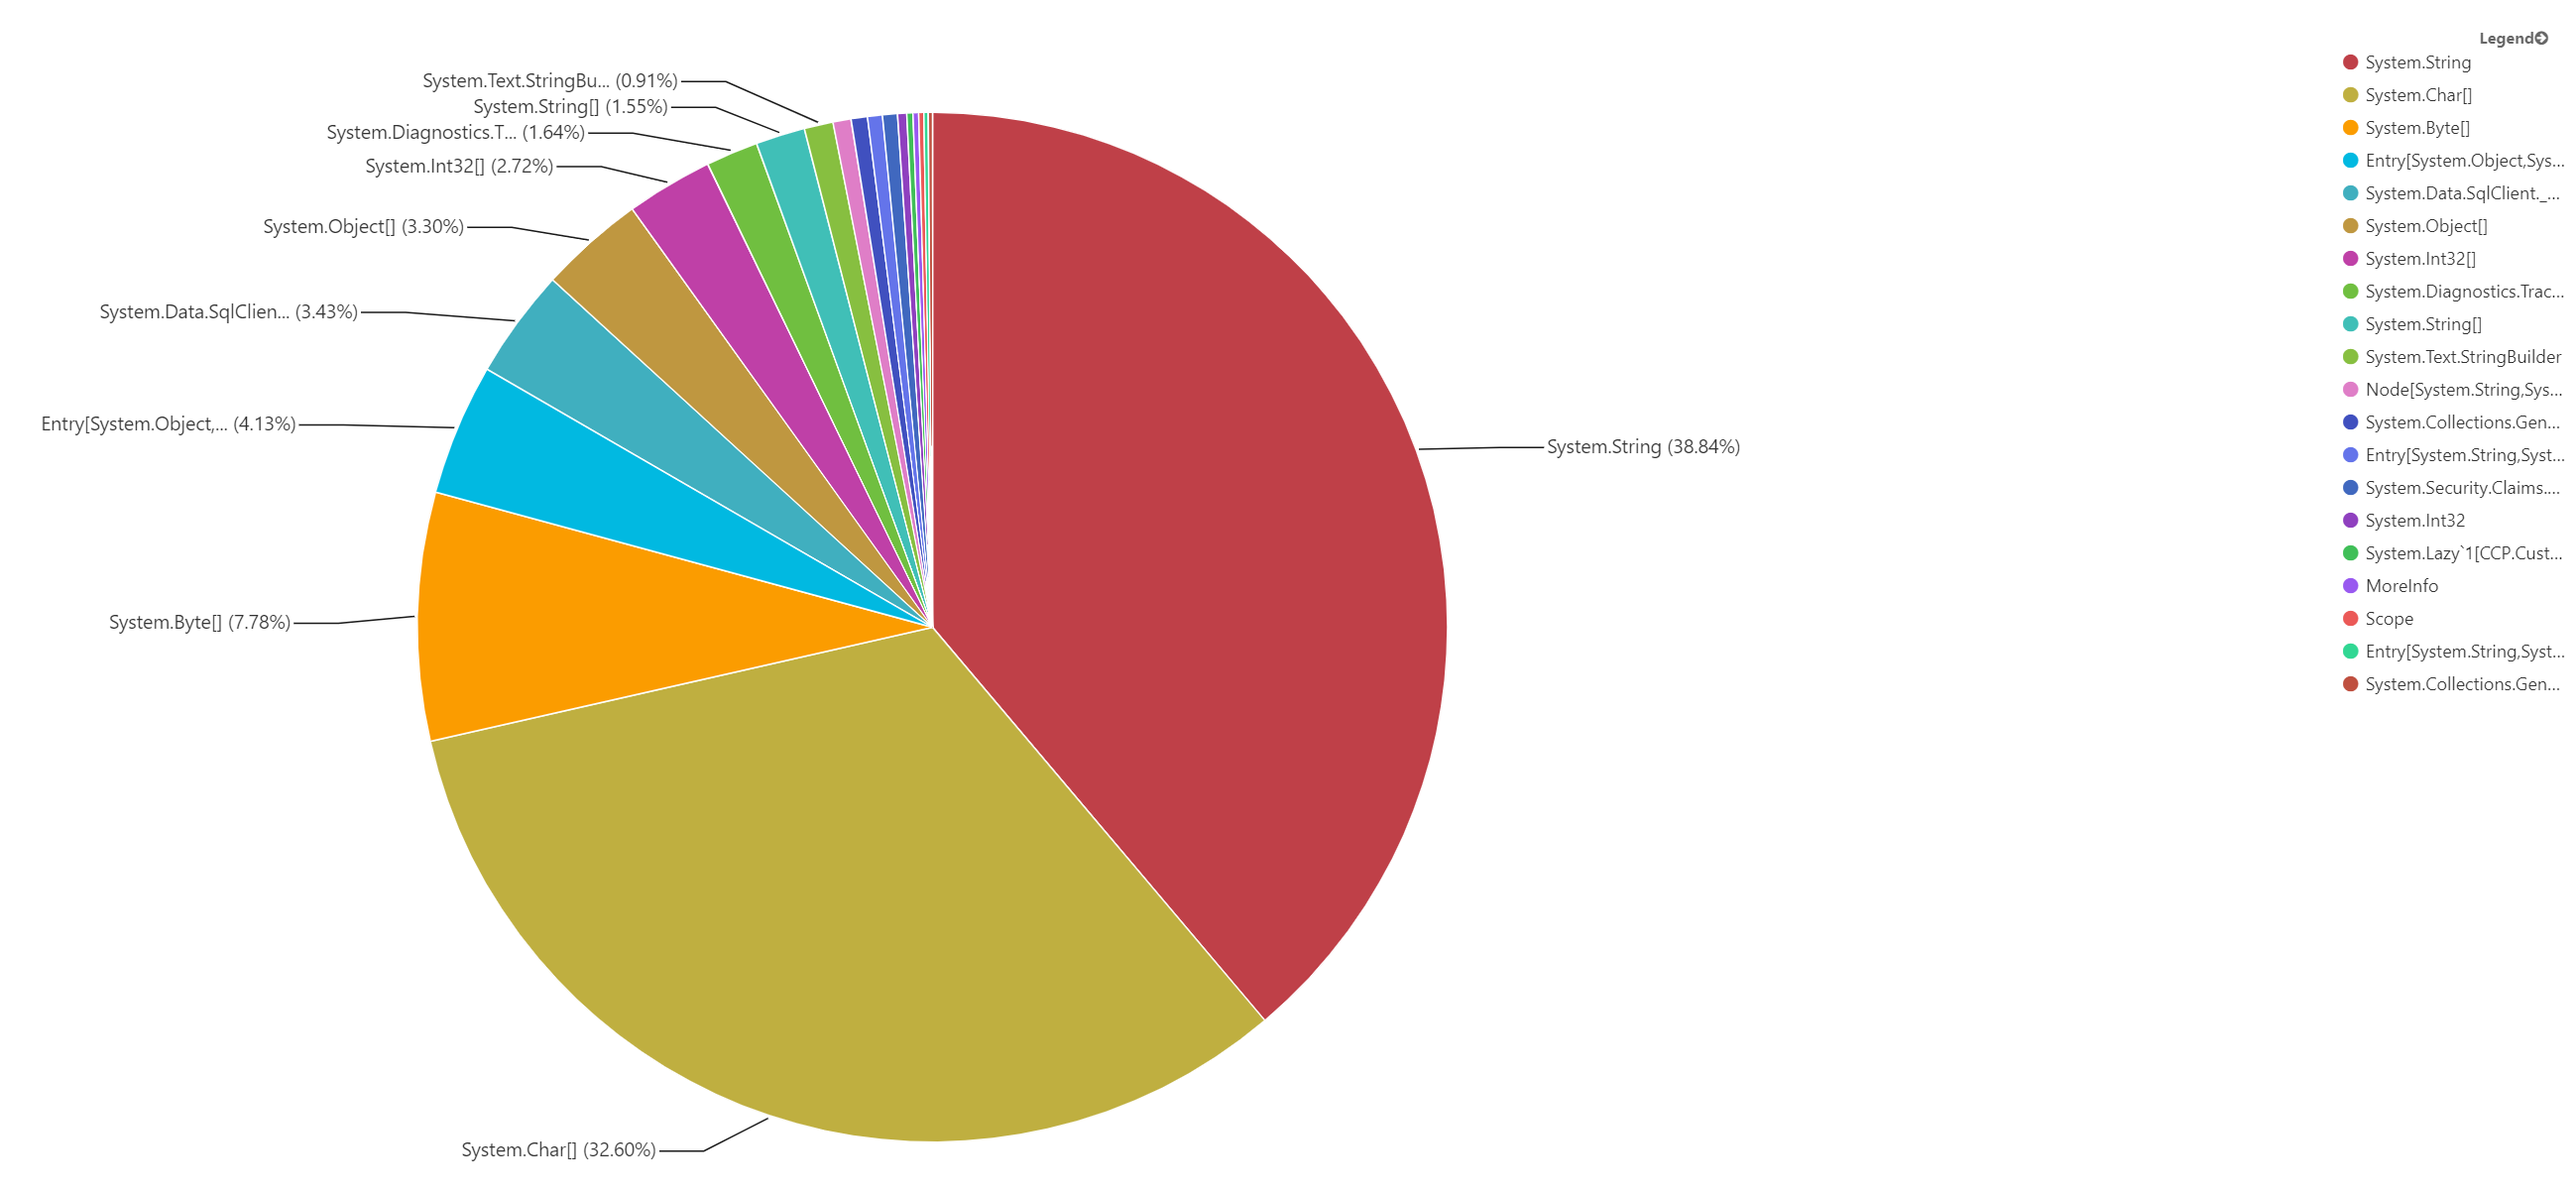
Memory allocated by type (sampled, top 20)
customMetrics
| where name == "Allocated Memory"
| project valueSum, type = tostring(customDimensions["Type"])
| summarize bytesAllocated = sum(valueSum) by type
| order by bytesAllocated desc
| take 20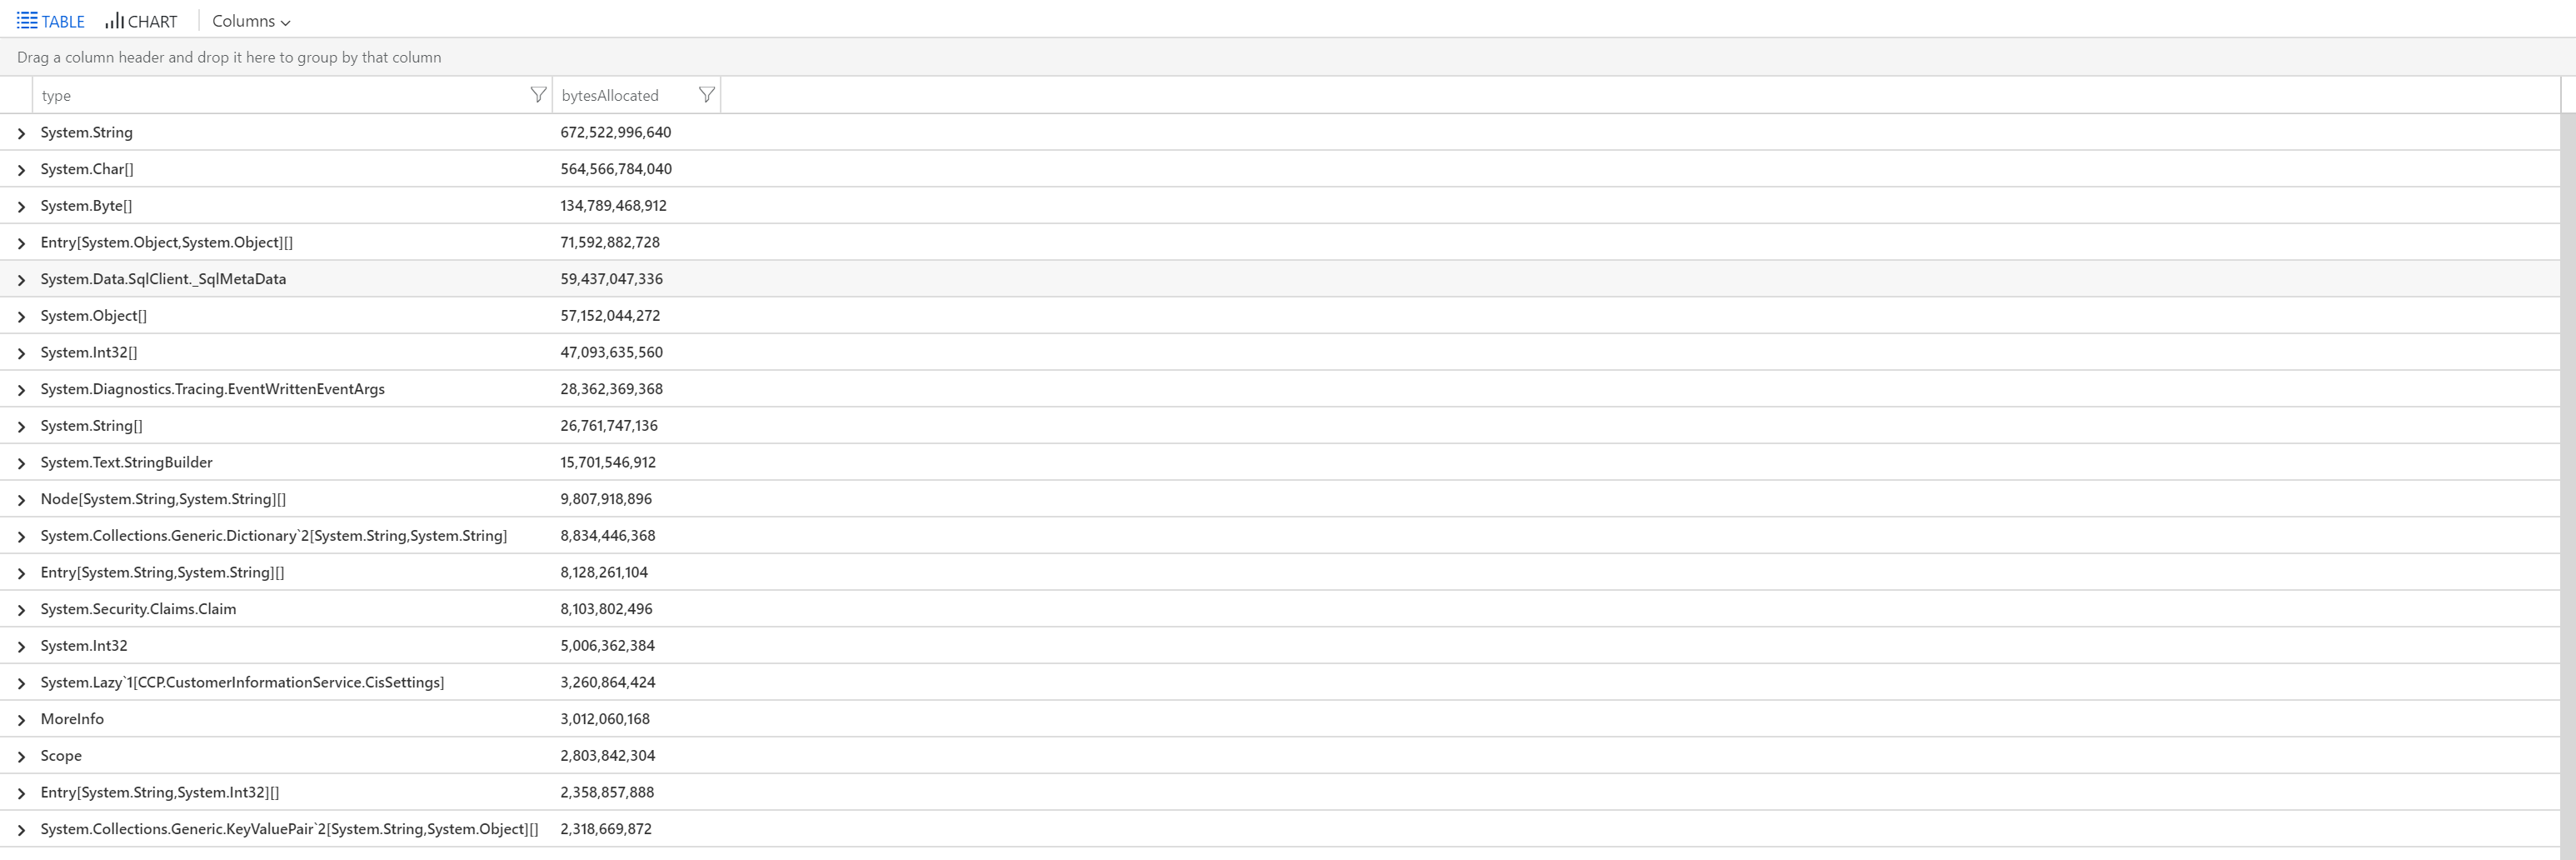
Conclusion
With this new event source in .NET Core 2.2, a whole heap of diagnostics information can now be gathered in-process which can help you to gather information about your application behavior and to help you troubleshoot issues. If you are at all interested in how your application is performing server-side, this is an excellent source of diagnostics data.