
.NET/Visual Studio Productivity Tips - Part 1
There are many useful shortcuts and methods in .NET and Visual Studio to make coding and debugging a lot easier. I'm going to share some of my favorites.


There are many useful shortcuts and methods in .NET and Visual Studio to make coding and debugging a lot easier. I'm going to share some of my favorites.
CTRL+. (Period) or ALT+Enter
This is without a doubt my favorite by far! This handy shortcut triggers the "Quick Actions" menu in the text editor, and it was a HUGE productivity booster for me when I discovered and started to use it. If you don't know what I mean by "Quick Actions", it's this awesome menu
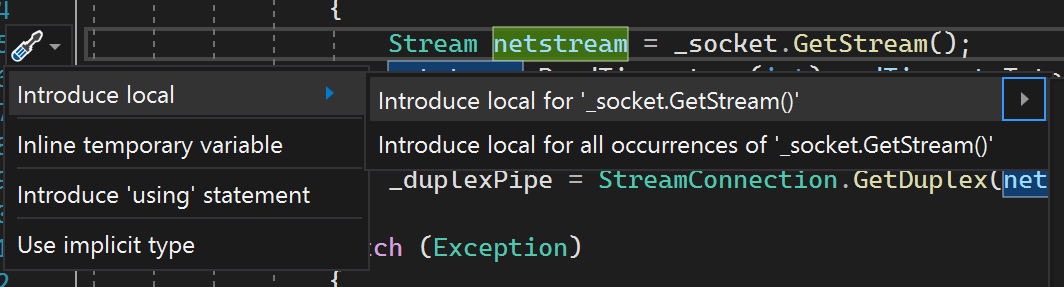
Being able to trigger it quickly while writing code and refactoring, without using the mouse, sped up my development a lot.
The [DebuggerDisplay] attribute
Did you know that you can write your own display mechanism for the debugger without overriding ToString()? Yep, it's called the DebuggerDisplay attribute and it works like this. Let's say you have your standard Points struct.
public struct Point
{
    public int X { get; }
    public int Y { get; }

    public Point(int x, int y)
    {
        X = x;
        Y = y;
    }
}
By default it will display in the debugger like this:
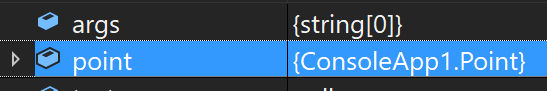
Not terribly useful, right? Let's make it easier to debug! If we add the System.Diagnostics.DebuggerDisplay attribute we can define how we want the debugger to display our Point.
[System.Diagnostics.DebuggerDisplay("X = {X} Y = {Y}")]
public struct Point
{
    public int X { get; }
    public int Y { get; }

    public Point(int x, int y)
    {
        X = x;
        Y = y;
    }
}
This will make the debugger render our Point struct like this:
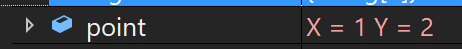
Much better! We can even customize it even further by telling the attribute to get a certain property to render the display:
[System.Diagnostics.DebuggerDisplay("{RenderDebugger,nq}")]
public struct Point
{
    public int X { get; }
    public int Y { get; }

    public Point(int x, int y)
    {
        X = x;
        Y = y;
    }

    private string RenderDebugger => $"{X},{Y}";
}
Which makes it render like this:
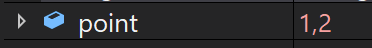
You might be wondering what the ,nq part means. That simply means that the debugger should strip out the quotation marks (nq = no quotes) since our RenderDebugger property returns a string.
What's also awesome, is using this on custom collections or lists to render counts, sums or whatever is applicable for those objects for a much better experience when debugging our own objects.
Happy debugging!